Demystifying: Portfolio Color Coding
Understanding portfolio color coding is going to unlock key benefit of APS. Once you understood this convention your report reading time will be just few seconds. Luckily it is not tough to understand and that process will take just few minutes.
So, here is a typical portfolio looks like (if portfolio is active)
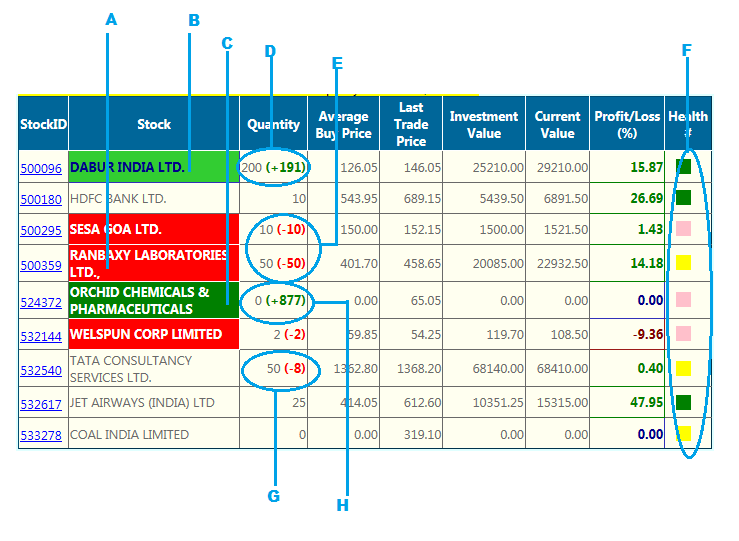
Sample Active Portfolio
Remember, the most important columns are Stock and Quantity. Even if you forget everything else explained in this article, believe me, you are not going to lose anything. So, let me tell you crux first and explanation later. If a stock (in 'Stock' column)has color green then look into 'Quantity' column and buy the quantity shown in the bracket. If a stock has color red then just go and sell the quantity shown in the bracket in 'Quantity' column
This system not only signals you when to buy and when to sell but also how much on basis of your portfolio budget and number of stocks limit you have set during portfolio creation. Budget allocation per stock dynamically changes as your portfolio grows and you have to do nothing except just do the entries of each transaction in this system without any miss.
Explanation Item wise
A: Stock is in red zone. Sell off complete holding. Quantity column is confirming the same by showing all 50 sell off.
B: Stock is in light green zone. It means it was already on upward move and recently (within a week) it has shown fresh positive signal. Here system has noticed you have allocated currently less than the actual amount, so it is suggesting buying 191 more stocks at this re-entry point to re-balance the portfolio.
C: This is dark green zone and it means, stock has changed the direction from bearish (or sideways) to bullish. Our system is recommending buying this stock. Quantity column is suggesting (877) how much you can buy to match per stock allocated budget. Did you notice, you had not invested in this stock but it was still reflecting in your portfolio? Yes, this same portfolio system also works as alert (or trigger) system. So, just register your favorite stocks here and our system will give alert when to buy and when to sell at appropriate time.
D: We have already explained during 'B'. This colored item in bracket is suggesting exact number of stock which you can buy to keep you portfolio balanced.
E: This has been explained during 'A'. Again this is suggesting how much to sell (in this case 'All')
F:This part of the table is just communicating what is the health of stock at moment. There are five categories of health. Green means very good health (stock is moving most likely better than market and peer group). Light Green means on growth path but less than market and/or peer group. Red means it is in bad health and one should not invest during this phase. Colors Yellow and Pink has different meaning according to overall position of the stock.
If current position is invested and color is 'Pink' it means stock is losing momentum and it may be early sign of fall down. By next week it will either goes in 'Red' or back to 'Green'. Investors who don't like to take much risk (especially if they have already made satisfactory profit) will exit at moment and wait for next re-entry point. Some other may offload part of the holding and wait for next event.
If current position is not invested then color 'Pink' means it is recovering from deep bearish position. Nothing much to conclude. For investment our strict recommendation is waiting for color 'Green'.
Color 'Yellow' has meaning sideways or inconclusive. Here, nothing much to conclude. However, if another stock in the same sector has just turned to green then our reporting system will suggest you to exit from this current holding and enter in other one.
G:This is little unique case. Stock has no 'Red' mark still 'Quantity' column is suggesting selling off. This is going to be happening in two cases.
1. Investor has bought for amount more than allocated per stock.
2. Stock has zoomed the price and net worth has crossed the allocated budget (remember allocated budget is dynamic. If all stocks will grow with same pace then system will never suggest to sell off). This feature has two significances. First, it insist to keep your portfolio close to balance composition and second it is harvesting the fruit from fast growing stock which may crash after a while to maintain the pace with peer group.
H: This case has been already explained during item 'C'. System is suggesting how much to buy according to your allocated budget per stock.
Rests of the columns are self-explained by its title. First column has BSE code for the stock and it is also hyperlink to take you to stock review page for this particular stock
Did you like this article? Please share it with your social network